MPGAfold Visualizer
MPGAfold Visualizer is a Java based application which extends the functionality of MPGAfold. When MPGAfold is used in conjunction with the MPGAfold Visualizer, all operating and running conditions of MPGAfold are delegated to the MPGAfold Visualizer. Furthermore, MPGAfold Visualizer provides an interface that allows the user to visualize an MPGAfold run and even interact with that run. The various aspects of MPGAfold Visualizer are detailed below.
Contents
- MPGAfold Visualizer User Interface
- Running MPGAfold Using MPGAfold Visualizer
- MPGAfold as a Standalone Application
- Setting up an MPGAfold Run Using MPGAfold Visualizer
- Starting MPGAfold Using MPGAfold Visualizer
- Interacting with MPGAfold through MPGAfold Visualizer
- StructureLab as a Way to Augment MPGAfold visualization
MPGAfold Visualizer User Interface
General Information
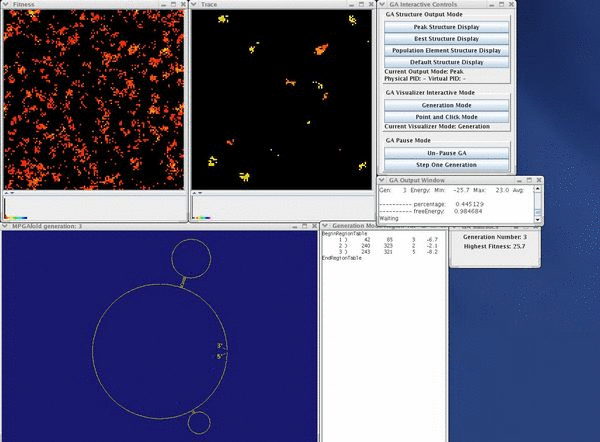
The main user interface of MPGAfold Visualizer consists of three different windows. These windows can be considered gateways that peer upon the information contained in an MPGAfold run. Each window houses a vast array of pixels along with a histogram. The array represents the current population of the MPGAfold run and each pixel in that array represents a member of the population. The color or shade of a pixel depicts certain facts about the population element it represents. The precise facts differ depending on the window and will be discussed later on. The histogram depicts the distribution of pixels over the window's color gradient (which represents the window's specific range of data).
As the MPGAfold run advances and the population undergoes changes, each pixel's color will be updated accordingly. For example, if a population element undergoes a change in topology and thus attains a better fitness, the pixel representing that sturcture will change color. As time progresses and the run advances in generation, it is possible to see large changes taking place across the array of pixels. In some instances, the viewer may see the population converge to one color or he or she may see two distinct colors appear and then compete with one another for dominance. The shifts in color directly correlate to what is occuring within the MPGAfold run and thus, represent the search for the optimal solution.
Fitness Map
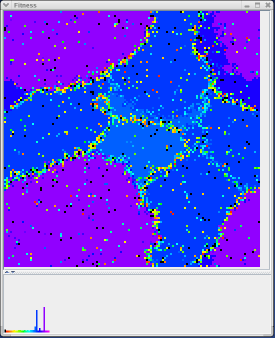
The fitness map is the most important of all three MPGAfold Visualizer maps. Each pixel in the fitness map represents the relative fitness of a population element. The pixel's color depicts the population element's relative fitness. Each pixel can be one of several colors: black, red, orange, yellow, green, blue, purple, and pink. Black pixels represent population elements with very low relative fitness where as pink pixels represent population elements with reletively high fitness levels. All the other colors represent fitness levels inbetween the two extremes. The gradient of fitness levels (low to high) correpsonds to the order of the colors listed above.
When the MPGAfold run advances, each population element undergoes a change in topology. If this change is beneficial and results in the structure having a lower free energy, the color of the pixel representing this structure will change towards the pink end. If, however, the change is negative and results in an energy gain, than the color of the pixel will decrease towards black. As the pixels change in color over time, it is possible to see the MPGAfold run converging on a solution structure of optimal free energy. This would be represented when the majority of pixels are pink. Besides demonstrating the convergence of a population, the color change over time of the fitness map can convey folding characteristics of a sequence along with any intermediary topologies that remain prevalent over the course of several generations. This information can be important in identifying the folding pathway of a sequence in addition to the liklihood of it attaining the predicted solution structure.
Trace Map
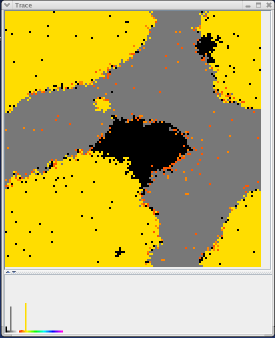
When setting up an MPGAfold run, the user can specify a stem trace file. The stem trace file contains a list of stems which will be noted and followed by MPGAfold. The trace window allows a user to see which population elements contain the stems denoted in the trace file.
Every stem in the trace file is assigned a certain color. When that stem appears in a population element's topology, the representative pixel changes to that color. If a population element does not contain any stem from the trace file, the pixel is black. If a population element contains multiple stems from the trace file, the pixel will be a shade of gray. The number of stems visible in a topology and the total number of stems specified in the trace file determines the exact shade of gray. If a population element contains every stem specified in the trace file, than that pixel will be white.
The trace window is useful because it allows the user to follow important stems. From the trace window alone, the user can determine if the emergence of a specific stem is directly related to a specific topology or another stem. When used in conjunction with the fitness window, the user can form a connection between population elements which contain a certain stem and the fitness associated with those population elements. From this information, the user can determine if the emergence of a specific stem directly correlates with a drop in free energy.
Pseudoknot Map
During the course of a run, a population element may assume a topology which includes a pseudonknot. The pseudoknot map allows the user to track the appearence of pseudoknots by color coding population elements based on the number of pseudoknots present in their topologies.
Point and Click Interface
The fitness, trace, and pseudoknot windows all share a powerful feature that allows the user to mine more data from an MPGAfold run. Every single pixel on each window represents a population element within the MPGAfold run. The color of the pixel is not the only information that can be attained about that population element. Much more information can be obtained by simply clicking on a pixel.
When the user clicks on a pixel, a signal is sent to MPGAfold. Upon recieving the signal, MPGAfold determines which population element that pixel corresponds to and then dumps a variety of information about that population element. The information is sent back to MPGAfold Visualizer and displayed in a pop-up window.
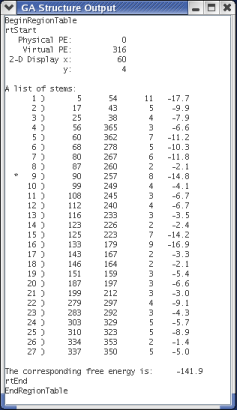
The pop-up window displays information about the actual population element itself. This information includes its location (the physical and virtual processors) and the population element's position in the array of pixels. The next piece of information is the region table which denotes the population element's topology. If a trace file was provided, stems that appear in the trace file will be marked with an asterick. The last piece of information given is the energy of the structure.
By using the fitness, trace, and pseudoknot windows along with the point and click interface, a user can uncover a wealth of information about an MPGAfold run. These tools allow a user to not only gain information about one member of a run's population, but to also compare that information with other population elements across the entire population. Futhermore, since the fitness, trace, and pseudoknot windows are dynamic along with the information contained in each pixel, it is possible to view and chart changes in both a single element and the entire population over time.
Running MPGAfold Using MPGAfold Visualizer
MPGAfold as a Standalone Application
While MPGAfold is an extremely powerful application, its visual effect is non-existent because it is a command-line application. The user starts MPGAfold by issuing a command that conducts three different tasks: initialize the processors, start the application, and specify the configuration file. After that command, the user cannot interact with MPGAfold. Furthermore, when MPGAfold runs by itself, there is not much to watch. As the program progresses, the only visual confirmation of it running is statistics being output to the command line. These statistics are hard coded into MPGAfold and there is no way to interactively change what MPGAfold outputs as it runs.
As MPGAfold runs, it constantly writes files that contain information about each population element's topology. When it finishes, MPGAfold can optionally clean these files up through concatenation. In order to view statistics about a certain population element, the user must sort through hundreds of files and then open the file and read it using a text editor. Imagine if you want to view the topology of several different population elements over several different generations. That goal makes the process of finding a file and then opening the file extremely tedious.
MPGAfold Visualizer was developed to solve MPGAfold's ouput and visualization problems. MPGAfold Visualizer allows the user to dynamically change what MPGAfold outputs and eliminates the need to find and open multiple text files. Additionally, MPGAfold Visualizer provides a very nice user interface (see above) for visualizing what is currently transpiring within an MPGAfold run.
Setting up an MPGAfold Run Using MPGAfold Visualizer
Prior to MPGAfold Visualizer, an MPGAfold run had to be set up by writing a configuration file. The configuration file specified many parameters which defined how MPGAfold ran, how energy calculations were performed, which input files were used, and how output files were written. When writing a new configuration file, it was typically easiest to just copy an existing file and then make the necessary changes. Otherwise, the user would have to write a the file using specific syntax and numerous variables.
MPGAfold Visualizer makes the configuration process, along with the start up process, much easier through the use of several intuitive setup windows. The configuration panel can be accessed from the main panel by choosing File > Configure Run. Upon choosing this option, a window will pop up displaying four different tabs. Each tab pertains to a certain aspect of the configuration process.
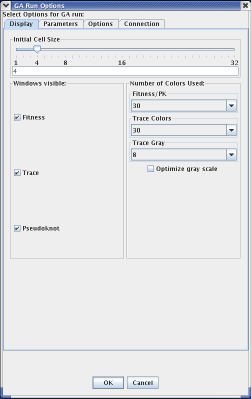
The tab initially displayed when the menu appears is "Display." The display tab doesn't directly relate to MPGAfold itself; rather, this tab allows the user to configure how MPGAfold Visualizer displays the information it recieves from MPGAfold. Using the display panel, a user can choose the size of each pixel in the fitness, trace, and pseudoknot windows. The user can optionally turn off either the fitness, trace, or pseudonknot windows. Additionally, the user can choose how many colors the corresponding windows use to display the information from MPGAfold.
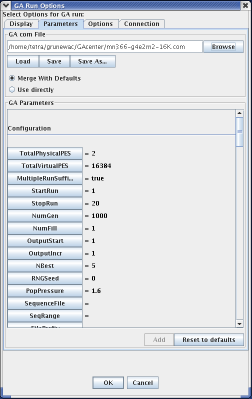
"Parameters" is the next tab in the configuration menu. Using this tab, the user configures the MPGAfold run by either importing a pre-existing configuration file or by defining parameters through the graphical user interface provided by the panel. If the user has already written a configuration file, then he or she can simply browse to that file and then load it into MPGAfold Visualizer. Upon loading the configuration file, the window will update the "GA Parameters" list to correspond with the configuration file. Once a configuration file is loaded, the user can optionally change parameters by using the interface. If no configuration file exists, the user can create one by selecting the options that fit their needs. Once they have configured the run to their liking, the user can save the specified parameters as a configuration file, allowing them to load the parameters later on. For a complete list of all the parameters and their effect on an MPGAfold run, please click here.
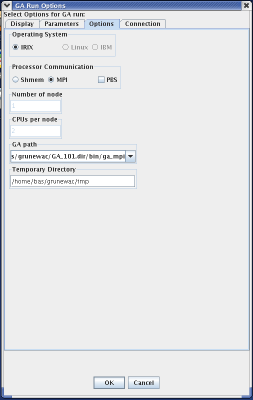
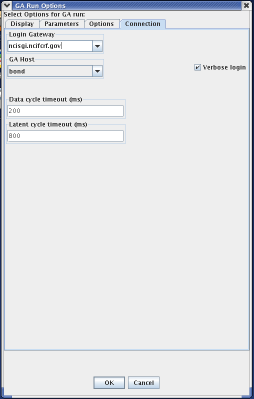
While the next tab in the GA Run Options menu is the "Options" tab, it is important to discuss the "Connection" tab first. The connection tab allows the user to select the machine that will run MPGAfold. The two important fields on this menu are the Login Gateway and the GA Host. The GA Host field specifies which machine will run MPGAfold. The Login Gateway specifies the machine which will log into the GA Host machine. In other words, when MPGAfold Visualizer starts MPGAfold, it first connects to the Login Gateway and then from the Login Gateway, it connects to the GA Host. Once connected to the GA Host, MPGAfold Visualizer will launch MPGAfold.
The "Options" tab should be configured after the Login Gateway and GA Host are chosen because the choices in the options panel change based upon the choice of Login Gateway and GA Host. Every GAHost has an associated configuration file. Each GA Host configuration file stores information pertanent to that machine, such as architecture, paths to MPGAfold binaries, temporary directories, and if SHMEM or MPI processor communication is available. The options menu will only allow choices if they are present in the configuration file. Most of the time, the user can use the defaults. However, if the user needs to use a certain version of MPGAfold, those conditions can be specified using this panel.
Starting MPGAfold Using MPGAfold Visualizer
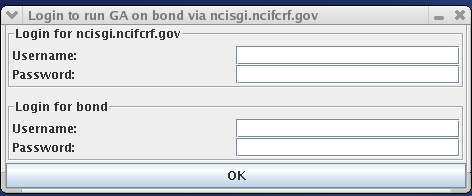
Once the run is configured, the user can start MPGAfold. This is done by going to Exec > Start on the main menu. Note that there is also an option for a Test Start. This option can be selected without configuring the run and allows someone to quickly see MPGAfold Visualizer in action. Once Start (or even Test Start) is chosen, several different windows appear, most importantly the login window. The login window provides four fields: a username and password field for the Gateway machine and a username and password field for the GA Host machine.
Assuming that the login information was entered correctly and all the parameters are in order, MPGAfold Visualizer will start MPGAfold. On a sucessful start, the fitness, trace, and pseudoknot windows will appear (as long as they were enabled under Display options). At this point, the user can either sit back and watch or take a more interactive approach in viewing the run.
Interacting with MPGAfold through MPGAfold Visualizer
Using the GA Interactive Control Menu, a user can dynamically change MPGAfold's output with the click of a button. This menu controls the two main methods of interacting with MPGAfold through the visualizer. One method has already been discussed above, namely the point and click interface. The other method is slightly more complex and involves a generational dumping of information. This is known as Generation Mode and will be elaborated upon below.
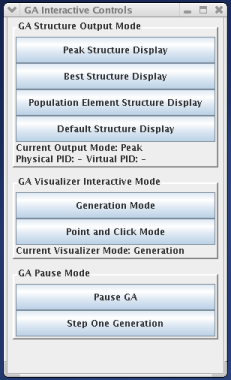
Using the GA Interactive Control Menu, a user can switch between the two different output/visualization modes of MPGAfold: either Point and Click Mode or Generation Mode. Point and Click Mode allows the user to interactively click on population elements in either the fitness, trace, or pseudoknot windows. When a population element is clicked on, information regarding that element appears in a seperate window.
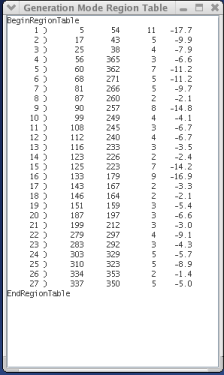
Generation Mode affects the information displayed in the Generation Mode Region Table window. Generation mode has three different run states, each one selectable via the GA Interactive Controls menu, specifically in the GA Structure Output Mode section of the menu. The three run states are Peak Structure Display, Best Structure Display, and Population Element Display. When the Peak Structure Display run state is chosen, the Generation Mode Region Table window will display region table of the current generation's solution structure. When the Best Structure Display run state is chosen, the Generation Mode Region Table window will display the region table of the structure that has the lowest free energy. The final run state, Population Element Display, will display the region table of a certain population element each generation. The exact population element that is displayed can be selected by clicking in either the fitness, trace, or pseudoknot windows. The final option available on the GA Interactive Controls menu is Default Structure Display, which will revert the Generation Mode's run state to whatever the configuration file specified.
The Peak Structure Display run state is useful because it allows the user to see which structure is currently believed to be the solution structure. As MPGAfold runs, the region table in the Generation Mode Region Table window will update as better solutions are found. The Best Structure Display run state displays the structures with the lowest free energy. These structures do not always agree with the structures returned by the Peak Structure Display run state. Thus, the Best Structure Display run state is useful because it enables the user to compare the structure with the best energy and the solution structure. The Population Element Display run state allows the user to follow a certain population element across multiple generations. Using this run state, the user can analyze the change in a population element's topology over time.
Aside from allowing the user to change the output modes of MPGAfold by using either the Point and Click mode or the Generation mode, the GA Interactive Control menu gives the user a very quick way to pause MPGAfold and subsequently step through generations one at a time. Pausing MPGAfold is not only useful, but often necessary. When in Point and Click Mode, a user often wants to click on several different population elements. If MPGAfold is not paused, this task can be difficult because the generation will advance before the user has a chance to click on all the desired population elements. Pausing MPGAfold gives the user all the time they need to point and click on various population elements.
MPGAfold Visualizer as an Extension to StructureLab
Structure Visualization with StructureLab
Both MPGAfold and MPGAfold Visualizer can only deal with RNA secondary structure at the region table level; both lack a mechanism to actually draw the secondary structure. StructureLab, on the other hand, has the ability to take a region table and draw the secondary structure that region table defines. StructureLab also provides a number of useful drawing tools that manipulate the secondary structure image. Some of these tools include annotation methods, un-tangling methods, and rotation methods.
Coupling MPGAfold Visualizer and StructureLab
In order to take advantage of StructureLab's drawing functions, MPGAfold Visualizer and StructureLab had to be connected. This was accomplished by allowing the user to start MPGAfold Visualizer through StructureLab. Then, during the course of the run, MPGAfold Visualizer would send region tables to StructureLab. Once StructureLab recieved the region table, it would be rendered using StructureLab's drawing functions.
Using MPGAfold Visualizer with StructureLab
The coupling of MPGAfold Visualizer and StructureLab was implemented to allow the existing functionality of MPGAfold Visualizer to carry over into StructureLab. When MPGAfold Visualizer runs concurrently with StructureLab, the interactive and visualization features of MPGAfold Visualizer not only continue to function; they provide more functionality when combined with StructureLab.
The GA Interactive Control menu formed the main interface with which users interacted with MPGAfold Visualizer. Using this menu, the users could switch between two different output modes, Point and Click mode and Generation mode. In Generation mode, there were three different states that changed which region table was output after every generation. When MPGAfold Visualizer is launched through StructureLab, the GA Interactive Control menu still acts as the main interface to MPGAfold; however, now it additionally forms the main communication hub with StructureLab.
In both Point and Click mode and Generation mode, StructureLab creates a window that displays the secondary structure of whatever region table is produced in the current mode. In the case of Point and Click mode, the drawing window will update to reflect the secondary structure of whichever population element the user clicks on. This secondary structure will remain drawn until the mode is either changed or a new population element is clicked on. When MPGAfold Visualizer is run in Generation mode, the drawing window will be updated every generation with a new structure determined by the current run state of Generation mode. If the run state is Population Element Display, the drawing window will display that population element's topology every generation. If the run state is Peak Display, the drawing window will display the peak structure of every generation.
The pause functionality continues to work since the communication pipeline between StructureLab and MPGAfold Visualizer remains open. When the user selects Pause on the GA Interactive Control menu, only MPGAfold is paused; the user can still click on structures and see the results in StructureLab's drawing window.
Aside from merely displaying a drawing of a secondary structure, StructureLab will also label any stems that appear in the stem trace file (specified in the configuration file). Thus, as various secondary structures are drawn, any stems appearing in the stem trace file will be clearly marked in the drawing window.
MPGAfold Visualizer and StrucutureLab in Action
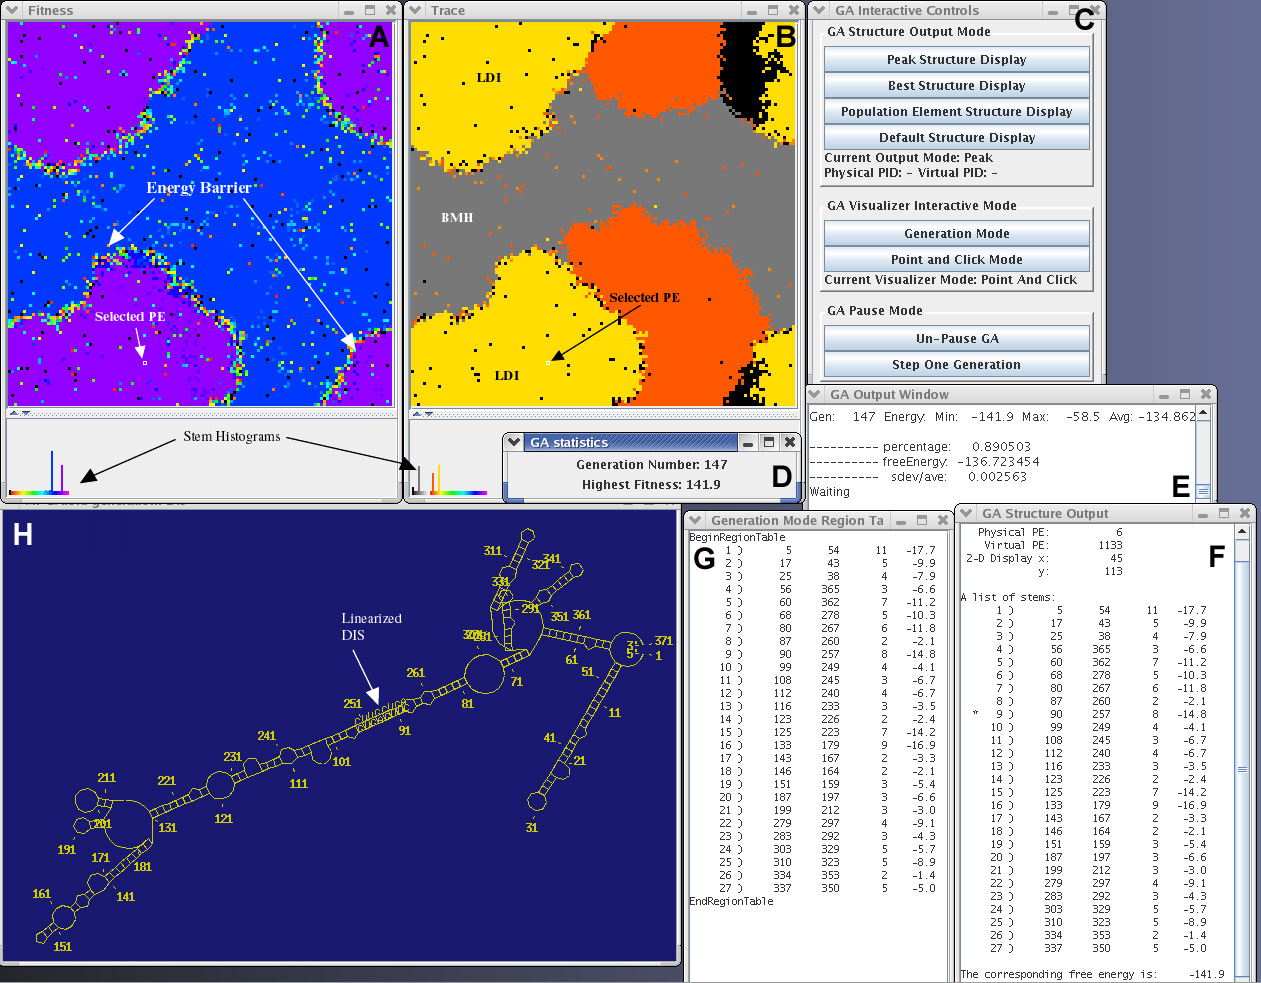
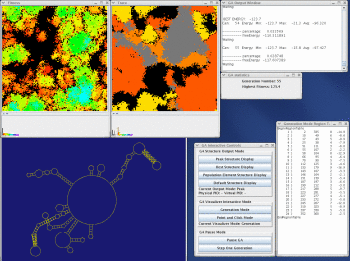
This image depicts the interface windows for MPGAfold Visualizer and StructureLab. The windows shown in A and B contain the structure fitness and region trace maps of a 16K population run. The pixel positions in each 128x128 map correspond to each other.
A. This is a fitness map representing the later stages of an MPGAfold run. Each pixel of this map is color coded based on the corresponding structure's fitness level. The region annotated "energy barrier" indicates that the structures on each side of the barrier are quite different. The pixels in the energy barrier represent structures undergoing unfolding to allow for a transition.
B. The trace map allows the user to follow the appearence of stems specified in the stem trace file. In this particular trace, the yellow areas correspond to structures containing the LDI (linear) stem of the HIV linear conformation. The red areas correspond to the structures containing the poly(A) SL stem of the HIV branched conformation. Their presence indicates evolving structures with one of the two key elements of the branched HIV conformation.
Both the trace map and fitness map windows have histograms at the bottom of the menu. Both histograms show two peaks corresponding to the two dominant conformations of HIV.
C. The GA Interactive Control Panel. MPGAfold Visualizer is currently running in the Point and Click mode allowing the user to interactively view the topologies of various population elements.
D and E. Population statistics display windows.
F. This region table, representing the branched conformation of HIV, was interactivly extracted from the selected population element (depicted in A and B). The stems that have an asterick next to them correspond to traced stems.
G. Region table representing the peak structure of the current generation. This region table denotes the topology of the linear conformation of HIV (yellow areas in the trace map and yellow peak in Trace histogram).
H. RNA secondary structure drawn by StructureLab based on the selected population element's region table. This drawing illustrates the branched conformation of HIV.