Stem Histogram: The Concept

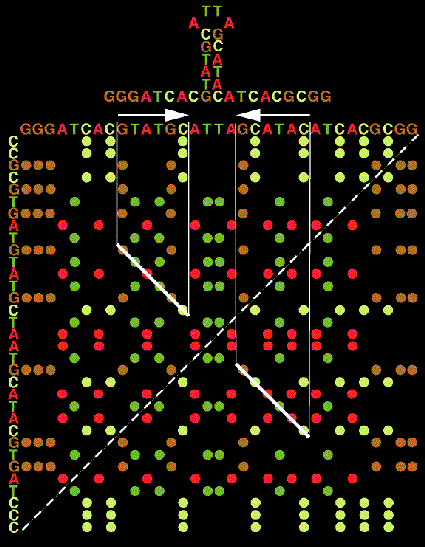
All the generated 'potential' regions may be visualized with what may be called a 'graphic matrix' (or stem histogram), a two-dimensional plot of all paired bases. Along the horizontal axis (left to right) is the base sequence data ordered from the 5'-end of the molecule to the 3'-end. Along the vertical axis (top to bottom) is the reverse complement of the sequence. The reverse complement orders the molecule from the 3'-end to the 5'-end and all the bases in the sequence are complemented. The origin of the matrix, the (1,1) position, is in the upper left corner. A dot is placed at each position in the matrix where the base represented by the horizontal coordinate is equal to the base represented by the vertical coordinate. (Since we are dealing with a complemented sequence along the vertical axis, equality represents complementarily.) Thus, all the 'potential' regions appear as diagonal lines in the matrix, the length of a diagonal depicts the length of a bonding run or the size of a region, and the position of a diagonal indicates what bases in the sequence are actually partaking in the pairing. It should be noted that only the upper half of the matrix needs to be displayed since the upper and lower halves of the matrix are symmetrical. (Shapiro and Lipkin 1983).
In general, attempting to line up selected regions in near diagonals tends to produce more stable configurations than a random selection. This is because diagonal runs tend to minimize the destabilizing influences of loops. Internal loops are indicated in the matrix by gaps between chosen regions. The larger the gap the larger the loop. The more displaced from a diagonal two consecutive regions are, the more unequal are the two sides comprising the internal loop. Hairpin loops are indicated by the gaps that exist between the last diagonal region and the principal matrix diagonal, running form the lower left corner to the upper right corner.
It should be noted that pairs of regions that overlap are not permitted since they would produce structures which allow bases to pair to more then one other base. These overlapping structures are indicated in the matrix by the intersection of the regions' vertical and /or horizontal projections. Knot-like structures are indicated in the matrix by those areas in which the vertical (horizontal) projection of a gap intersects the vertical (horizontal) projection of a region and this region's horizontal (vertical) projection lies outside the gap.
Stem Histogram of the HIV-1 MN MPGAfold Results

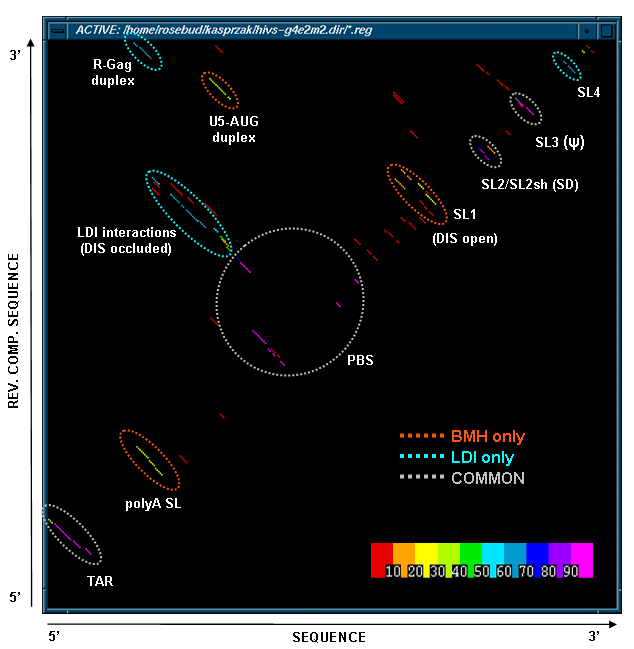
This figure below shows a stem histogram plot of our MPGAfold (Massively Parallel Genetic Algorithm) results for multiple population (2K through 64K) folding runs of HIV-1 MN 366nt long 5' UTR domain. Color scale used to code the frequency of appearance of stens is shown in the lower right-hand cornet. Stems shared in all the predicted structures are circled in light gray, stems unique to the branched (BMH) conformers are circled in red, and stems unique to the linear (LDI) conformers arecircled in light blue. The BMH and the LDI motifs are mutually exclusive. Thus this stem histogram plot shows two alternative conformations of the HIV-1 5' UTR domain predicted by MPGAfold.
Stem Histogram of the Polio 3 Sabin Mfold Results

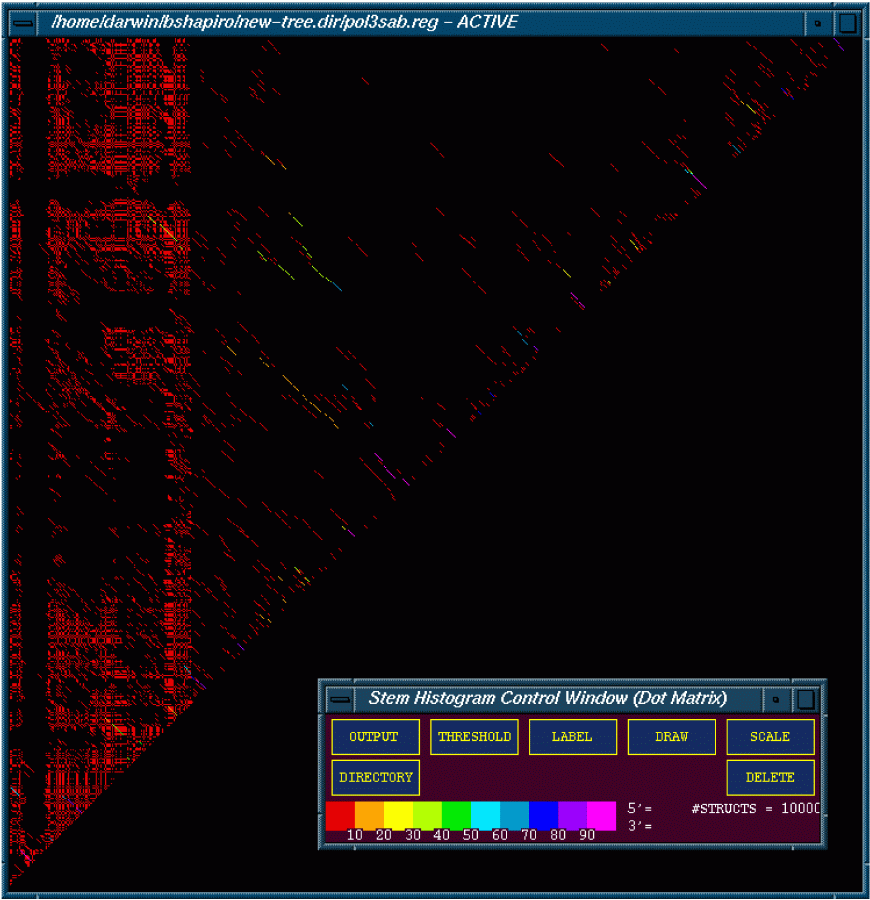
This figure is of 10,000 optimal and suboptimal structures of the polio 3 sabin strain folded using the 2dynamic programing algorithm (DPA). The figure is color coded with red meaning that less then 10% of the structures contained a particular stem. Magenta means that over 90% of the structures contain the particular stem.
One can also interact with the diagonals to extract information associated with the stems. In addition one can threshold the matrix to examine stems that reside within the specified limits from structures that are depicted.